June 7, 2023
Market Performance (YTD)
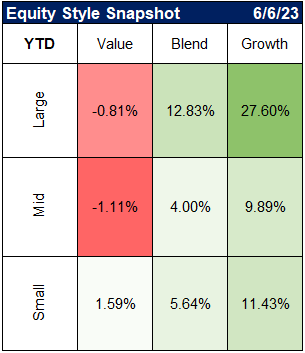
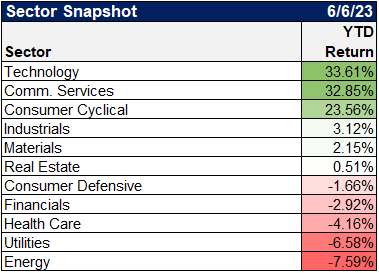
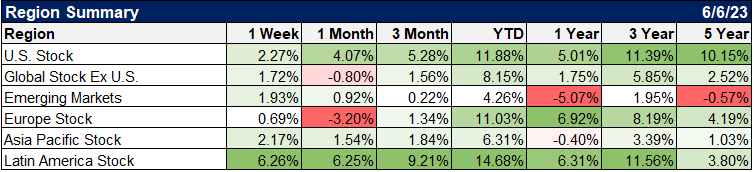
Source: YCharts
Disclaimer: Past performance is no guarantee of future performance
BREAKING: The US added 339,000 jobs in May versus estimates of 195,000; US unemployment rate rises to 3.7% vs 3.4% https://t.co/QRyl0nqIJv pic.twitter.com/HK6EurOmaf
— Bloomberg (@business) June 2, 2023
How many times does a report have to come in better than expected before you adjust your models? pic.twitter.com/4S7Yb8dD2Q
— Bespoke (@bespokeinvest) June 2, 2023
Prime-age labor force participation — that’s workers aged 25 to 54 — ticked up in May to 83.4% from 83.3% in April. That could partially explain the lift in the unemployment rate. It shows that people came into the labor force last month, but may not yet have found a job… pic.twitter.com/Z06YzvKZoX
— Bloomberg (@business) June 2, 2023
Some notable sectors: Construction added 25k jobs and continues to defy expectations. Leisure & hospitality added 48k — growth there is solid but no longer a flat-out boom. Retail continued its bumpy ride, adding about 12k jobs. pic.twitter.com/Ndbbehajl4
— Ben Casselman (@bencasselman) June 2, 2023
For much of the recovery, wages were rising fastest in low-paying industries. But that hasn't really been true recently. Mid-wage industries are now raising pay faster than both low- and high-wage sectors. pic.twitter.com/zmcTPCZiiX
— Ben Casselman (@bencasselman) June 2, 2023
While job gains have been robust, average weekly hours worked declined further. Now at the lower end of where this was during the last expansion. pic.twitter.com/8JGYT9kd9t
— Liz Young (@LizYoungStrat) June 2, 2023
Topline takeaways of May jobs report:
—Employers reporting very strong job growth, while households are reporting that the labor market is slowing (thus the higher unemployment rate)
—Job growth super hot, but wage growth decelerated and labor force participation didn’t budge— Victoria Guida (@vtg2) June 2, 2023
APOLLO: “Delinquency rates for credit card borrowers are approaching 2008 levels across all age categories.” pic.twitter.com/fTJUvJUVzz
— Carl Quintanilla (@carlquintanilla) June 1, 2023
The S&P "7" returned 54% year-to-date
The index itself 12%
But if we net out the S&P "7" and look at the remaining 493 firms, they only returned 2%
The S&P "7" consist of $META, $AMZN, $AAPL, $MSFT, $GOOGL, $TSLA, and $NVDA
Do you think that this concentration is sustainable? pic.twitter.com/mckerEsP8y
— Markets & Mayhem (@Mayhem4Markets) June 5, 2023
The S&P 500 is outperforming the equally-weighted S&P 500 by over 10% year-to-date, the largest outperformance on record at this point in the year with data going back to 1990.https://t.co/Cn3fD5pESh pic.twitter.com/2uSFx8JDTV
— Charlie Bilello (@charliebilello) June 6, 2023
Early-cycle bull markets usually are led by small caps. That is definitely not happening right now. pic.twitter.com/JMewU2Z1kw
— Jurrien Timmer (@TimmerFidelity) June 6, 2023
The Russell 2000 to the Nasdaq-100 has fallen to levels seen in the 2000s. pic.twitter.com/zahq3k5aAL
— Ayesha Tariq, CFA (@AyeshaTariq) June 6, 2023
Historically, unprofitable companies have held the index back. The equal weighted R2K is up 94% since 2006 versus down 2.6% for the unprofitable Cos.
Profitable cohort is up 234% over the same time frame. pic.twitter.com/uw1xXN3uxp
— Michael Casper (@MikeACasper) June 2, 2023
This guidance unleashed a buying spree that sent NVDA’s market capitalization up by $200 billion in a single day – the single greatest daily increase in the history of the U.S. stock market
With a roughly $1 trillion market capitalization, $NVDA now trades for 38x sales
— Porter & Company (@Porter_and_Co) June 2, 2023
CMBS Delinquency Rate Shoots Up in May 2023 – Biggest Jump Since June 2020: Overall Rate Hits 14-Month High
– In May 2023, the overall Trepp CMBS delinquency rate shot up 53 basis points to 3.62%.
– Offices Delinquencies jumped 125 basis points to 4.02% – First Time Since 2018… pic.twitter.com/uwHoj1ZRU7
— Ayesha Tariq, CFA (@AyeshaTariq) June 5, 2023
Disclosure
Clear Rock Advisors, LLC is registered with the SEC as a registered investment advisor with offices in Texas. Different types of investments involve varying degrees of risk. Therefore, it should not be assumed that future performance of any specific investment or investment strategy (including the investments and/or investment strategies recommended and/or undertaken by Clear Rock Advisors, LLC) or any investment-related or financial planning consulting services will be profitable, equal any corresponding indicated historical performance level(s), or prove successful. It remains the client’s responsibility to advise Clear Rock Advisors, LLC, in writing, if there are any changes in the client’s personal/financial situation or investment objectives for the purpose of reviewing, evaluating or revising Clear Rock Advisors, LLC’s previous recommendations and/or services, or if the client would like to impose, add to, or modify any reasonable restrictions to Clear Rock Advisors, LLC’s services. A copy of Clear Rock Advisors, LLC’s current written disclosure statement discussing its advisory services and fees are available upon request.