Market Commentary
Q3 2019
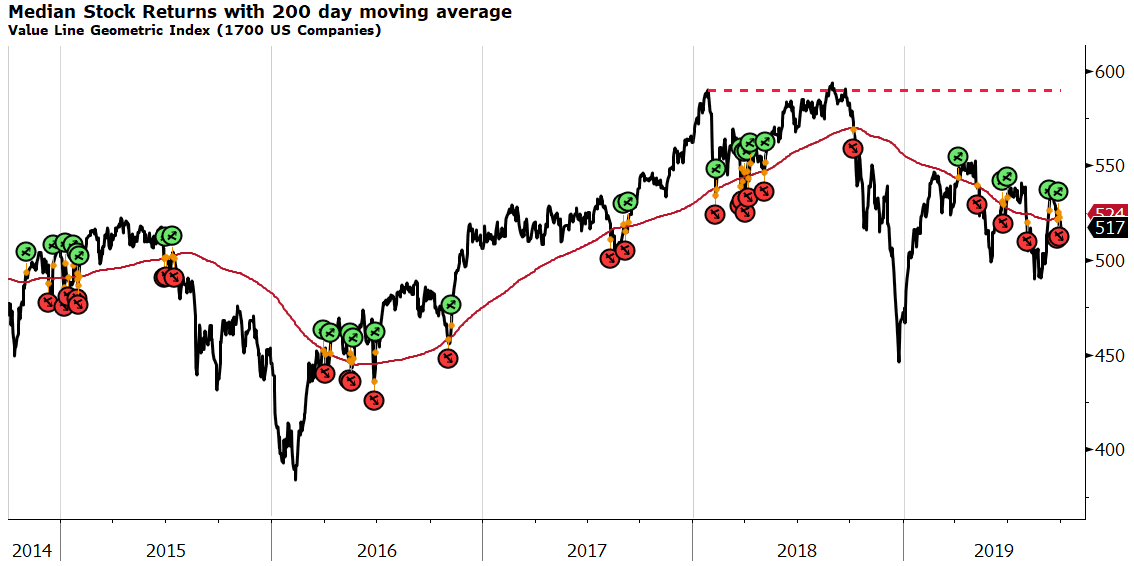
A valuable tool in gaining insight into the overall strength of the stock market is the Value Line Geometric Index. This index tracks 1700 US companies, making it a great indicator of market breadth. It includes small, mid, large and mega cap companies. In addition, it is calculated using an equal weighting methodology, meaning that each of the companies included, from the largest (think Microsoft, Apple, Exxon) down to the smallest have the same weight. The most widely followed index, the S&P 500, is weighted by size, giving the largest companies far more weight than smaller ones. A broad move up in stocks, like we experienced in 2017, was a rising tide that lifted all boats. However, since that time, market breadth has weakened dramatically.
The accompanying 5-year price chart makes it clear just how weak the market has been for the average stock since the market peaked in January 2018 and then again one year ago (September 2018). In fact, from those highs, the average US stock is down more than -11%. This broad weakness is masked by the size-weighted S&P 500 that is roughly flat (+1.1%) since January 2018 (21 months ago!) Big gains in large technology companies are primarily responsible for pulling the S&P 500 up to even. The “massive rally” in stocks this year simply recouped losses from the October-December sell-off last year, but most stocks are have not participated.

We continue to believe portfolios should be positioned to protect capital given our view that market and economic risks are elevated. Our stock weights are at the low end of our targets across all client investment objectives. Our allocation to alternative strategies is at the high end of our targets, representing uncorrelated sources of return that can generate attractive returns, even if stocks stumble. Alternatives, importantly, will provide a source of funds within the portfolio to add to riskier investments when prices are more attractive.
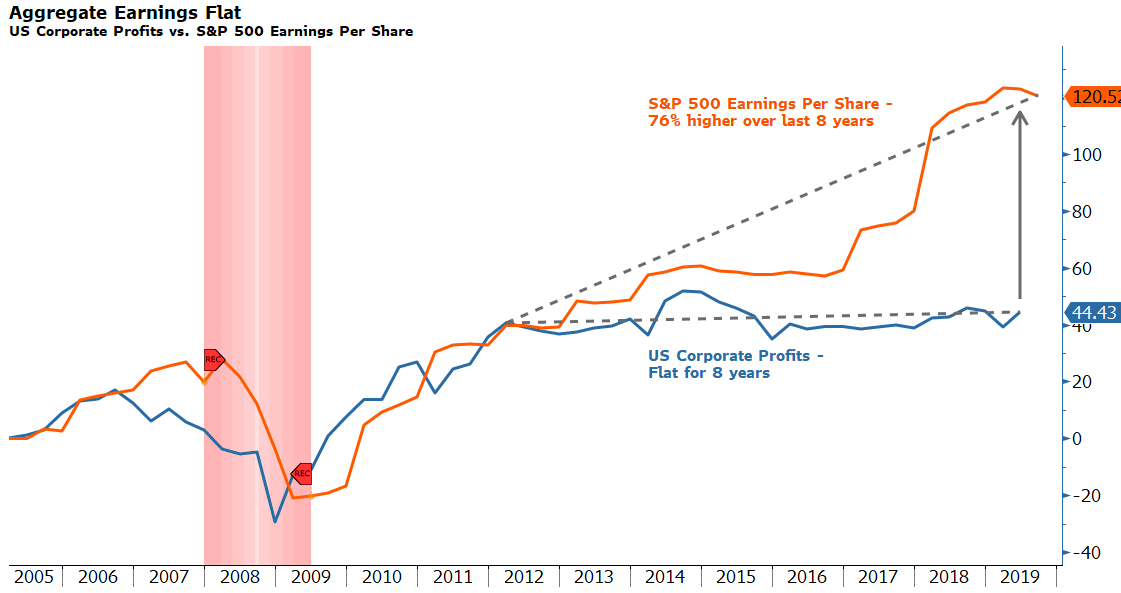
We’ve written about high valuations “borrowing returns from the future”. Price gains late in a cycle are typically driven more by multiple expansion than fundamentals as optimistic investors pay more and more for a dollar of revenues or earnings. Another late cycle phenomenon is financial engineering – creative ways companies make their earnings look better than they actually are. As the economy slows and earnings expectations become harder to achieve, companies often pull out two tried-and-true tricks. One is announcing “adjusted” earnings (non-GAAP) that ignore certain pesky expenses that cause earnings growth to look less impressive. The other, and one that has been used in this cycle to an unprecedented extent, is company-funded stock buybacks. When earnings growth slows, many companies, desperate to meet market expectations, create the illusion of growth by shrinking their shares outstanding. Voila! earnings per share are up (even if total earnings are flat or down).
The accompanying chart highlights the difference in aggregate corporate earnings reported through the US Bureau of Economic Analysis (blue line) versus aggregate earnings per share of the largest 500 US companies (orange line, S&P 500). Notice that aggregate earnings are basically flat over the past 8 years while S&P 500 EPS have grown 76% in the same time period. The red horizontal shaded area represents the last recession, which pulled down both measures of earnings with a corresponding down move in the stock market.

As mentioned, companies buying their own shares in the secondary market are another growth-enhancing trick and this phenomenon tends to accelerate at the end of a cycle – as it is now. This time however, the trend has had an adrenaline shot of artificially low interest rates. Low interest rates (and investors desperate for yield) have allowed companies to take on billions in debt specifically to buy back their own stock. Much of the new corporate debt issued today is not for investment (new plant and equipment, new hires), rather, financial engineering, which does nothing to sustain an already long-in-the-tooth expansion.
Despite some worrisome trends and our cautious outlook, we are still finding attractive areas to invest. Within our stock portfolios, we made additions to the defensive energy infrastructure stocks that we believe are undervalued and whose high and sustainable dividend yields should support the stocks through an economic slowdown. Our bond portfolios are also higher quality and we’ve removed risky corporate credit where yields are too low to compensate for potential downside. Within our alternatives portfolio we also increased exposure to high quality, cash return-oriented investments and removed investments with higher correlations to stocks. Our focus on quality and defensive sectors that generate a higher portion of their expected return through cash distributions and uncorrelated sources of return will help us through what appears to be shaping up as another tough 4th quarter for risky investments.
3Q 2019 Performance
Stocks
- Stocks globally were basically flat for the quarter (↑0.05%) with slight gains in US Large Cap stocks (↑1.05%), but losses in most other categories. US Mid Cap (↓0.56%), International Developed (↓0.79%), US Small Cap (↓2.08%), International Small Cap (↓2.61%), and Emerging Markets (↓4.75%) were all down for the quarter. US Dollar strength, particularly versus emerging markets currencies, hurt non-US returns.
- Non-US stocks continue to trade at a valuation discount to the US with a significant cash yield advantage (3.8% vs. 1.8%). However, while US earnings are struggling to show gains versus a year ago, Non-US stocks are in a more difficult position as economic growth decelerates and earnings estimates drop. We eliminated our exposure to Non-US small cap stocks late in the quarter as a result.
Bonds
- Total return for Taxable bonds turned in another extremely strong quarter (↑2.33%) as interest rates continued to fall. The yield on the US Aggregate Bond Index is down to 2.13% after peaking at 3.66% one year ago. Municipal bonds (↑1.49%), Securitized Credit (high quality mortgages and asset-backed securities) (↑1.74%), and High Yield Corporates (junk bonds) (↑1.19%) all benefitted from lower interest rates pushing up bond prices
- Looking forward, the yield curve has flattened dramatically with the considerable decrease in rates. The bond market is discounting a recession which is at odds with credit spreads that reflect optimism and are near all-time lows. Higher long-term interest rates may still be in the cards due to massive amounts of new supply entering the market, however, the Fed has reversed course on normalization and is once again pursuing lower short-term rates.
Alternatives
- The Alternatives portfolio was the best performing of the three Clear Rock asset class portfolios for the quarter, up (↑1.49%). Category performance was led by our new Real Assets investment (↑3.30%), Managed Futures (↑2.65%), Hedged Equity (↑1.10%), Multi Strategy (↑0.59%), and Market Neutral (↑0.18%).
- Equity Market Neutral continued to be pressured by the underperformance of the AQR Market Neutral strategy whose exposure to underperforming value stocks has been a headwind. The strategy was sold at the end of the quarter.
As always, contact us if would like to discuss these topics further.
Respectfully,
![]()
Royce W. Medlin, CFA, CAIA
Chief Investment Officer


