Market Commentary
Q2 2018
Inflation and Interest Rates Moving Higher
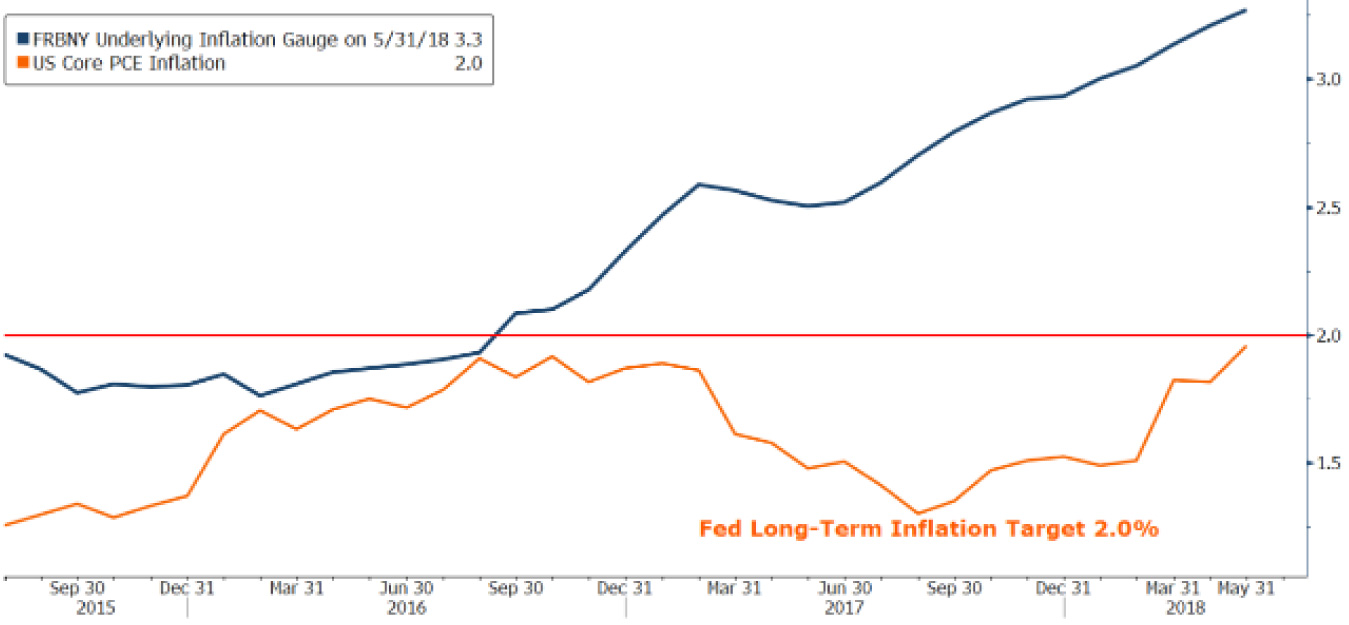
Short-term interest rates continued to move higher, pushed upward by the Fed’s continued pressure to normalize rates, while long-term interest rates took a breather during the 2nd quarter. After reaching a 5-year high of 3.11% in mid-May, the 10-year US Treasury ended only slightly higher at 2.86%. The yield on 2-year US Treasuries is now 2.55%, a level that is tempting many investors back into these almost risk-free investments. While short-term yields are higher, inflation is also moving up which limits real return. The chart below shows Core PCE inflation (orange line) approaching the Fed’s 2.0% inflation target, a sign of a strong economy, and an indication that the Fed’s plan to continue raising short term rates is still intact. Leading inflation indicators such as the FRBNY Underlying Inflation Gauge (blue line) continue to point to even higher inflation ahead.
Flatter Yield Curve
Over the past few months, markets have begun to worry that short term rates will increase faster than the economy can sustain, perhaps even eclipsing long term rates. Investor concern over an “inverted yield curve” (when short rates are higher than long rates) is based in historical significance and a predictor of recessions. In fact, the last three recessions were preceded by an inversion and its occurrence has come to be viewed as a reliable predictor of a slowdown. With Fed rate hikes expected to push short rates up to 3.50% by 2020 and long rates currently below 3.00%, the likelihood of an inversion has increased. The reality however is that, while this may be a useful predictor, it is not a timing tool. The last three recessions lagged the inversion by as long as 1-2 years. Our conclusion is that continued strong economic growth over the next 12-18 months will likely keep the curve positively sloped as short and long rates gradually move up in tandem.
Is the Global Economy Cooling? Maybe, But Not the US
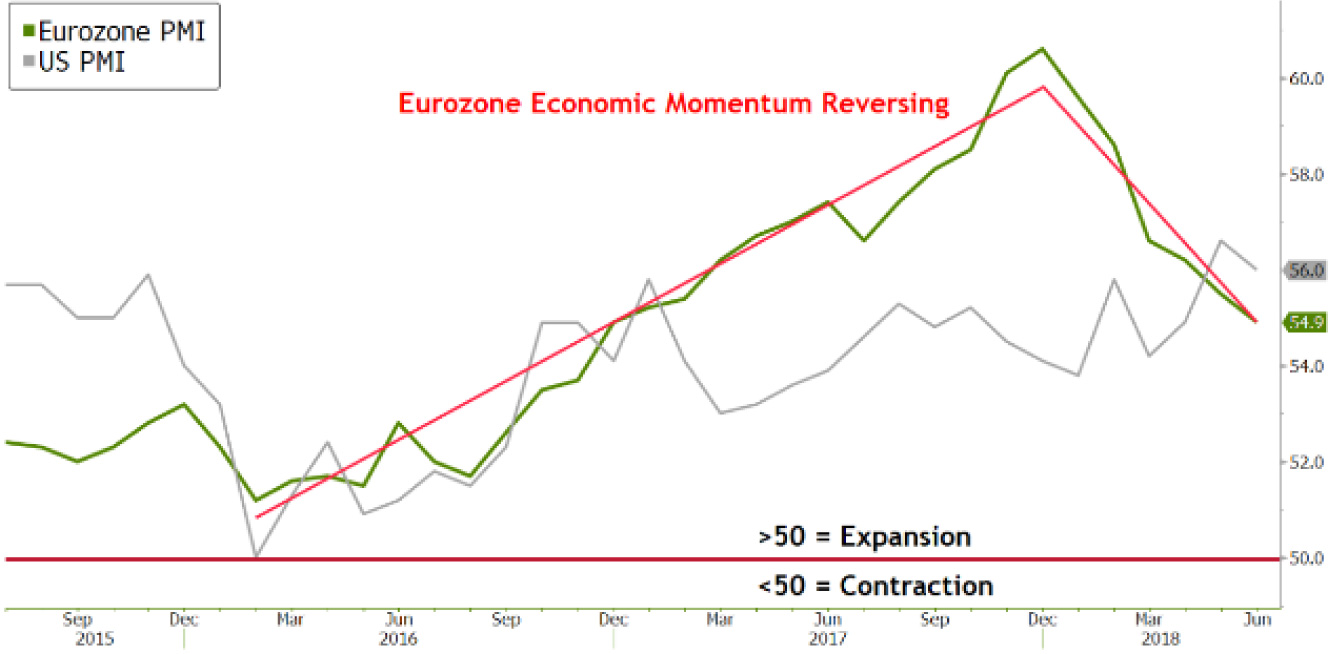
Over the past few quarters, we’ve cited strong global growth in Europe, Japan, China and emerging markets. However, there are a few signs of momentum reversing, particularly in Europe. The graph to the left shows both US and Eurozone PMIs (purchasing managers index) which are leading indicators of economic activity. Both have been strongly expansionary over the past couple of years (readings above 50 predict a growing economy). In fact, the Eurozone reached an all-time high reading just 6 months ago. However, it has since begun to moderate and may have peaked. In contrast, there are virtually no signs that the US conomy is slowing. To the contrary, the US continues to accelerate and is likely to hit GDP growth of 3% this calendar year, a level that hasn’t been reached since 2005. The unemployment rate recently dropped to 3.75%, the lowest level since 1969. Not as obvious in the headline yet another positive development is the re-employment of people who dropped out of the labor force over the past nine years but have been lured back in as more and better job opportunities have risen. A higher worker-age participation rate is a huge boost to growth, and important to government tax revenues.
Outlook for Stocks: Earnings Growth Peaking?
With a strong outlook for economic growth, US stocks should see continued support. However, tightening monetary policy means gains from multiple expansions are unlikely. Instead, stock price increases will be a function of earnings and dividend growth. With 22% earnings growth this year and 10% expected next year, improving fundamentals have made even the most overvalued stocks look more attractive. Despite the improvement, US stocks are expensive versus history, less so relative to earnings which have received a shot in the arm from lower tax rates, but especially versus revenues with the historical Price/Sales ratio in the 99th percentile of expensive. Europe, Japan, and emerging markets have underperformed this year after outperforming US stocks last year. The primary culprit is currencies, all of which appreciated versus the US Dollar last year but are now depreciating.
Valuations outside the US look much more attractive and fundamentals are still strong despite some mixed signals. Peak profitability levels which are likely to come under pressure is a concern for earnings growth as we move into 2019 and 2020. Higher interest rates will eventually cause corporate interest costs to rise while low levels of unemployment will eventually start to push up labor costs. It is likely that margins have already peaked.
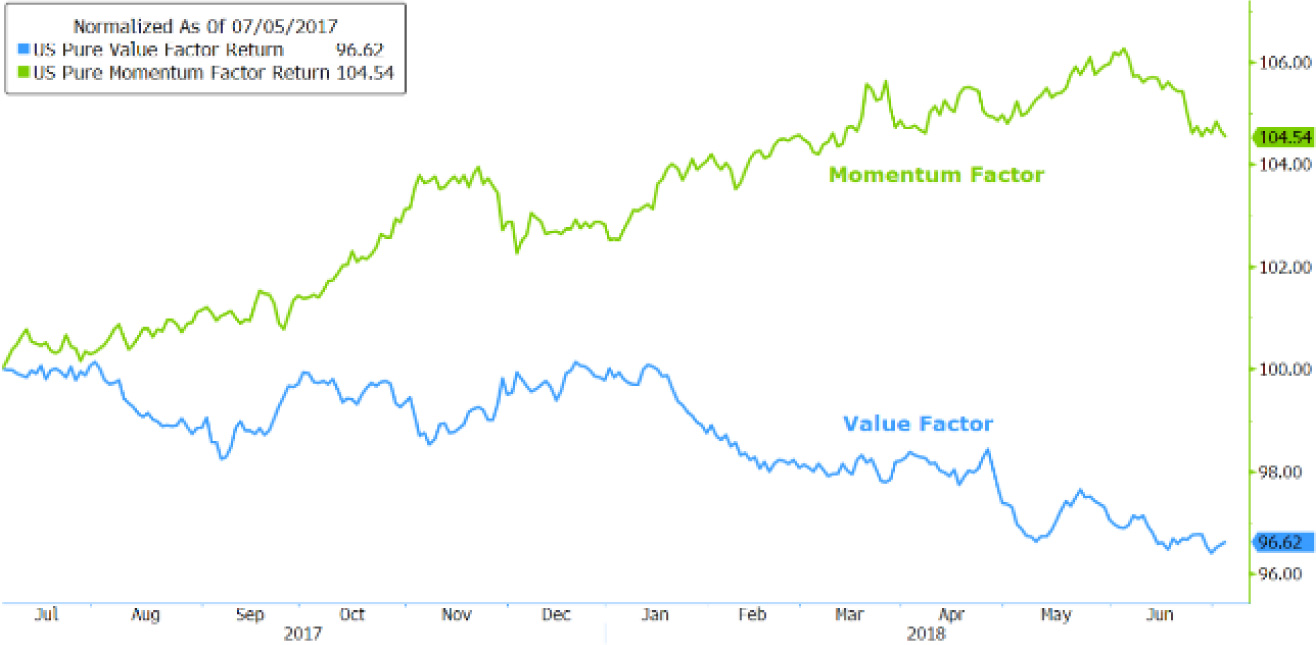
The chart below shows the two primary stock characteristics driving stock prices this year: Momentum and Value. Momentum markets tend to occur in the late stages of a bull market when more and more investors get excited about stocks and tend to buy the ones that have gone up the most lately (in this case stocks like Netflix, Amazon, Google, etc.). Conversely, investors get bored with “old economy” stocks and start to dump those that are not keeping up with the chosen few. The divergence in these two factors has not been as wide since market peaks in 2000 and 2007, which is a bit of a concern.
2nd Quarter 2018 Performance
Stocks
- Stocks globally were up (↑0.39%). Outperforming were US Large, Mid and Small Caps (↑3.43%, ↑4.05%, and ↑6.68%). nternational Developed, Small Cap, and Emerging Markets all fell during the quarter (↓1.96%, ↓2.63%, ↓9.79%). As mentioned above, value stocks continued their streak of underperformance.
- Looking ahead, global earnings reports continue to be strong, particularly in the US due to tax cuts, which should support stocks through year-end despite consternation over trade.
Bonds
- Broad market bonds were down slightly (↓0.18%) as interest rates ended unchanged on the long end. Municipals, Floating Rate Bank Loans, High Yield Corporates were all up slightly. Emerging markets debt (which was a huge positive contributor to returns since inception) was weak during the quarter (↓2.65%) and was eliminated from client portfolios.
- Looking forward, bond returns may get a reprieve from higher interest rates in the short term but are unlikely to earn much more than their coupons in 2018.
Alternatives
- The Alternatives portfolio turned in slightly negative performance for the quarter (↓1.75%). All four components were down: Hedged Equity (↓2.07%), Market Neutral (↓2.41%), Managed Futures (↓2.06%) and Multi Strategy (↓0.03%). Weakness was primarily attributable to the strong US Dollar hurting international stocks in the Hedged Equity as well as the Value factor.
- Despite the lackluster returns for the quarter, we continue to believe Alternatives offer true portfolio diversification and that our long-term risk and return objectives are achievable.
![]()
Royce W. Medlin, CFA, CAIA
Chief Investment Officer