Market Commentary 3Q 2023
KEY TAKEAWAYS
- Leading Indicators Still Point to Recession
- Deficits and Debt Back in Focus
- Compelling Risk/Reward for Bonds
- Stocks Need Broader Fundamental Support
- Focus on Protecting Capital
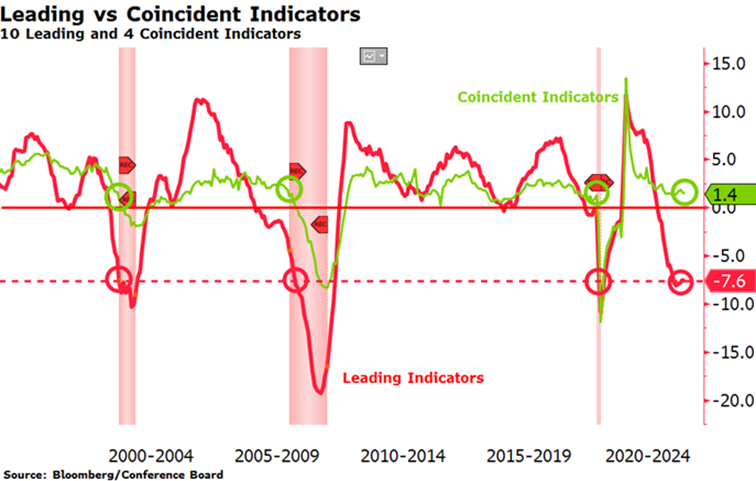
ECONOMY – LEADING INDICATORS POINT TO RECESSION
We continue to believe that economic growth is slowing and that higher interest rates will ultimately result in a recession. This forecast may seem at odds with recent economic releases, which have been generally positive, but it is important to delineate between coincident economic indicators and leading economic indicators. It is true that consumer spending and unemployment remain strong, but those are coincident economic indicators which have historically been positive going into a recession and have little value in predicting downturns. The accompanying chart shows coincident indicators in green and leading indicators in red. When recessions begin, coincident indicators are almost always positive, as they are now. Leading indicators, on the other hand, consist of new manufacturing orders, construction permits, business confidence, and the yield curve— all are at levels consistent with past recessions.
HIGHER INTEREST RATES BACK IN FOCUS
During the 3rd quarter, the Fed raised the short-term Fed Funds rate by 0.25% to 5.25%, but the real story occurred in the long end where yields rose to multi-year highs. The yield on the US Treasury 10-Year Note rose to 4.60%, the highest level since 2007, as deficit financing soared and quantitative tightening flooded the market with supply, pushing prices down and yields up. Stubbornly high inflation remains the key reason rates are staying elevated buttressing the Fed’s “higher for longer” stance. Higher rates are also a function of quantitative tightening, which is the process of shrinking the Fed’s balance sheet by letting US Treasuries and Mortgage-Backed securities roll-off – currently about $95 billion worth per month. As they mature, they must be refinanced in the open market, adding to supply and pressuring prices lower and rates higher. Removing the Fed as a primary buyer of Treasury and mortgage-backed bond issuance as deficits expand at unprecedented levels is a real-time experiment with unknown consequences.
STIMULUS EXPERIMENTS AND DOWNGRADES
As we have discussed in previous outlooks, the fiscal and monetary response to the COVID-19 shutdown unleashed the largest stimulus and spending spree since World War II. But the seeds for this radical government response were actually sown after the Global Financial Crisis of 2008. So large were the deficits at that time, Standard & Poors felt compelled to downgrade their rating on US debt from AAA to AA+. At the core of this extreme new experiment was setting interest rates at 0%. For the better part of 14 years since 2008, a risk-free rate of 0% has had profound implications on the economy and markets through distorted capital investment, inflated asset prices, and excessive debt issuance. Artificially cheap money pushed up prices of stocks, bonds, commercial and residential real estate, collectables, and even cryptocurrencies beyond their intrinsic values. Sadly, despite this unprecedented stimulus designed to spur economic growth, real private sector growth has been disappointing. In August, Fitch followed Standard & Poors, 12 years later, with their own downgrade. Fitch cited erosion of governance, rising deficits, increased debt and interest cost burden, uncertainty over the 2017 tax cuts that expire in 2025, and the current hiking cycle that may lead to recession.
Probably the worst unintended consequence of the experiment was the removal of any fiscal constraint or fear of economic damage created by overspending by politicians. If the Fed’s intention was to encourage reckless government spending, they succeeded. COVID-19-related spending was the catalyst for the 25% money supply explosion that created inflation, and inflation forced the hand of the Fed to raise rates at the fastest pace in 40 years. Interest costs as a percentage of the US Government budget have skyrocketed to multidecade highs, finally bringing attention to the problem. Politically, any attempt to slow government spending will be challenging. The size of government (government expenditures are 42% of GDP) relative to the private sector has grown too large and threatens to undermine the dynamism of the US economy.
BONDS ARE ATTRACTIVE
On a long-term basis, the risk/reward for bonds is now attractive, and expectations for future returns are much higher than in recent years. Unfortunately, today’s yields come at the expense of poor bond performance. Losses on 10-year and 30-year US Treasuries have been -46% and -53%, respectively. These declines are similar in magnitude to the bear markets in equities of 2000 and 2008.
The high likelihood of recession over the coming year means today’s high yields are especially attractive. Recessions are correlated with lower interest rates as the Fed reverses course and begins cutting short-term rates. Longer-term interest rates fall as inflation falls, which tends to occur as aggregate demand slows. The combination of attractive yields today, plus the likelihood that rates will fall in the future, creates an opportunity to earn above coupon returns going forward.
STOCKS NEED BROADER FUNDAMENTAL SUPPORT
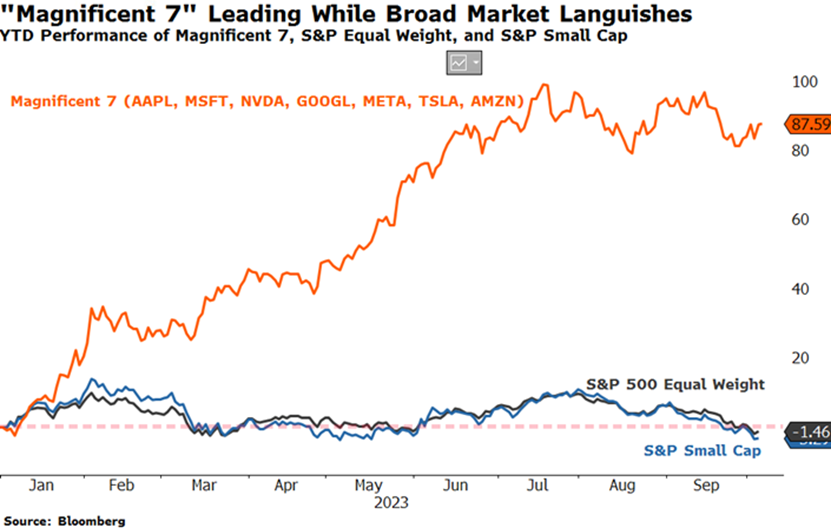
Small Cap stocks typically outperform in a new bull market, but they have been flat since the market bottomed one year ago. The likely culprit is earnings. Unlike mega cap stocks, whose earnings growth has remained relatively strong, small and medium-sized companies have seen earnings deteriorate significantly over the past year. The accompanying chart shows year-to-date performance of the leading mega cap technology stocks, dubbed the “Magnificent 7” due to their outperformance, versus the broader S&P 500 Equal Weight and the S&P Small Cap indices. As you can see, most of the positive return in the market has come from a very concentrated group of companies while the average stock has seen no gain this year.
While the broader market has underperformed, valuations are also much more attractive by historical standards. Small Cap stocks trade at about 13.0x forward EPS estimates versus large cap at 19.5x, a wider gap than normal. Typically, small cap stocks have more downside in a market sell-off, but if a bear market were to transpire, low valuations may bring outperformance versus large companies that trade at much higher multiples and are priced for uninterrupted growth.
CONTINUED CAUTION
We continue to position portfolios for late cycle volatility, emphasizing stocks with more durable earnings and dividends, high quality investment grade bonds, and alternative strategies that generate uncorrelated returns and outperform in downturns. Despite the stock market weakness in September, we do not believe the time has yet come to add meaningfully to stocks. That’s not to say that we aren’t finding some good companies trading at attractive multiples, however. Protecting capital remains our main focus, believing that a shift into higher return growth investments will present itself in due time and our patience will pay off.
Respectfully,
![]()
Royce W. Medlin, CFA, CAIA
Chief Investment Officer
Disclosure
Clear Rock Advisors, LLC is registered with the SEC as a registered investment advisor with offices in Texas. Different types of investments involve varying degrees of risk. Therefore, it should not be assumed that future performance of any specific investment or investment strategy (including the investments and/or investment strategies recommended and/or undertaken by Clear Rock Advisors, LLC) or any investment-related or financial planning consulting services will be profitable, equal any corresponding indicated historical performance level(s), or prove successful. It remains the client’s responsibility to advise Clear Rock Advisors, LLC, in writing, if there are any changes in the client’s personal/financial situation or investment objectives for the purpose of reviewing, evaluating or revising Clear Rock Advisors, LLC’s previous recommendations and/or services, or if the client would like to impose, add to, or modify any reasonable restrictions to Clear Rock Advisors, LLC’s services. A copy of Clear Rock Advisors, LLC’s current written disclosure statement discussing its advisory services and fees are available upon request.